The mean and variance of phylogenetic diversity under rarefaction
03 Sep 2012, by Erick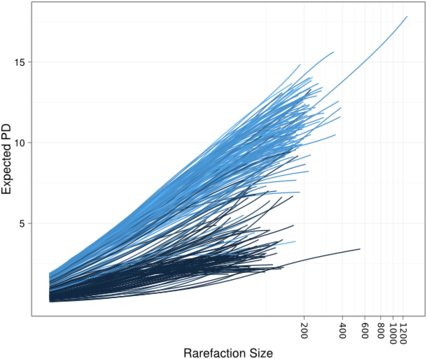 When comparing communities of organisms, it can be useful to characterize and compare their diversity.
A way of doing this that avoids that pesky discrete species concept is to use phylogenetic diversity (PD) to describe a the organisms in a sample.
However, like every diversity concept I can think of, if you work harder to sample a given environment (e.g. deeper sequencing) you will end up with more apparent diversity.
That doesn’t make for a fair comparison when you are looking at differences of diversity between samples.
A common way to do this is to rarefy samples, which is to take an equal-sized random subset of each of the samples.
When I started playing around with this a year ago, it didn’t seem like it would be hard to come up with a closed-form solution to the expectation of PD in the unrooted case.
Indeed, I doodled out a solution and then found that David Nipperess had done the same for the rooted case.
I then worked out the variance of PD under rarefaction in the rooted and unrooted cases, and David and I wrote it up.
The paper is now up on arXiv.
We also have some neat examples, including the example to the right, which shows how the shape of the rarefaction curve is different for different values of the Nugent diagnostic score (where dark blue -> low Nugent score, light blue -> high Nugent score).
When comparing communities of organisms, it can be useful to characterize and compare their diversity.
A way of doing this that avoids that pesky discrete species concept is to use phylogenetic diversity (PD) to describe a the organisms in a sample.
However, like every diversity concept I can think of, if you work harder to sample a given environment (e.g. deeper sequencing) you will end up with more apparent diversity.
That doesn’t make for a fair comparison when you are looking at differences of diversity between samples.
A common way to do this is to rarefy samples, which is to take an equal-sized random subset of each of the samples.
When I started playing around with this a year ago, it didn’t seem like it would be hard to come up with a closed-form solution to the expectation of PD in the unrooted case.
Indeed, I doodled out a solution and then found that David Nipperess had done the same for the rooted case.
I then worked out the variance of PD under rarefaction in the rooted and unrooted cases, and David and I wrote it up.
The paper is now up on arXiv.
We also have some neat examples, including the example to the right, which shows how the shape of the rarefaction curve is different for different values of the Nugent diagnostic score (where dark blue -> low Nugent score, light blue -> high Nugent score).